To track reply rates, divide the genuine human replies you receive by the emails that were actually delivered, then report that number per campaign, per step and per mailbox. Decide up front what counts as a reply, leave out bounces and out-of-office messages, and name your denominator every time you quote the figure. The rest of this guide shows you how to do that, how to log it consistently at volume, and what to do when the number looks wrong.
Key Takeaways
- Use delivered emails as the denominator, and count only real human replies. Auto-replies and bounce notices inflate or distort the figure.
- Track two numbers side by side: the overall reply rate and the positive reply rate. Only the second one predicts meetings.
- Published benchmarks disagree mostly because tools define “reply rate” differently, so compare your numbers against your own history first.
- Group every reply by campaign label, step and sending mailbox, so a drop can be traced to a cause.
- A low reply rate is often a deliverability or list problem before it is a copy problem. Check placement and bounces first.
Table of Contents
- What counts as a reply
- The formulas: three ways to calculate reply rate
- Metrics to track alongside reply rate
- How to track replies consistently at volume
- Reading the number: diagnosing a low or falling reply rate
- Improving reply rate and proving it worked
- Perspective
- Track replies in one place with PlusVibe
- FAQ
- Sources
What counts as a reply
Before you pick a formula, write down your reply definition. Most tracking confusion starts here, not in the math.
A practical rule set for cold outreach:
- Count: a real person answering your message, whether the answer is interested, not interested, a question, or a referral to a colleague.
- Don’t count: out-of-office notices, automatic acknowledgments, bounce and delivery-failure messages, and unsubscribe-only replies handled by a system.
- Label, don’t delete: tag each counted reply as positive, neutral or negative, so you can report both an all-replies rate and a positive reply rate.
The reason to be strict is practical. A large 2026 dataset of cold email found that automatic replies made up roughly half of everything landing in the reply folder, so a tool that counts them can report a number close to double the real one. Some platforms count auto-replies by default and let you switch that off. Check the setting in whatever you use, and keep it the same across campaigns.
A wrong-person reply deserves a judgment call. If the person points you to the right contact, it leads to pipeline through a warmer introduction, so label it as a referral and treat it as positive. If it is a flat “wrong person, no idea who,” it is noise.
The formulas: three ways to calculate reply rate
There is no single correct formula. There are several correct ones, and each answers a different question. SimpleVerifier’s per-step guide describes three that cover most needs.
| Formula | Calculation | Best for |
|---|---|---|
| Per prospect | Unique people who replied ÷ people whose step 1 was delivered | Judging the whole sequence and list quality |
| Per delivered email | Replies ÷ delivered emails across all steps | Comparing campaigns of similar length |
| Per step | Replies to step N ÷ step N delivered | Deciding which follow-ups earn their place |
A simple worked example, using the delivery-based formula. Prymatica’s glossary entry illustrates 45 replies from 1,500 delivered emails as a 3% reply rate. Send 1,500, lose 60 to bounces, and you have 1,440 delivered. Of 45 human replies, divide 45 by 1,440 and you get 3.1%. Divide by 1,500 sent and you get 3.0%. The gap is small here, but with a dirty list and 15% bounces it becomes large.
Why you should never add step rates together
Follow-ups raise the number of messages you send, but they do not raise the number of people you reach. That means step-level rates can’t simply be summed. If step 1 gets 2% and step 2 gets 1.5%, the sequence did not get 3.5% of prospects, because some replies come from the same person or from a different base of recipients. Report the per-prospect number for the sequence and the per-step numbers for diagnosis, and say which is which.
Why benchmarks disagree
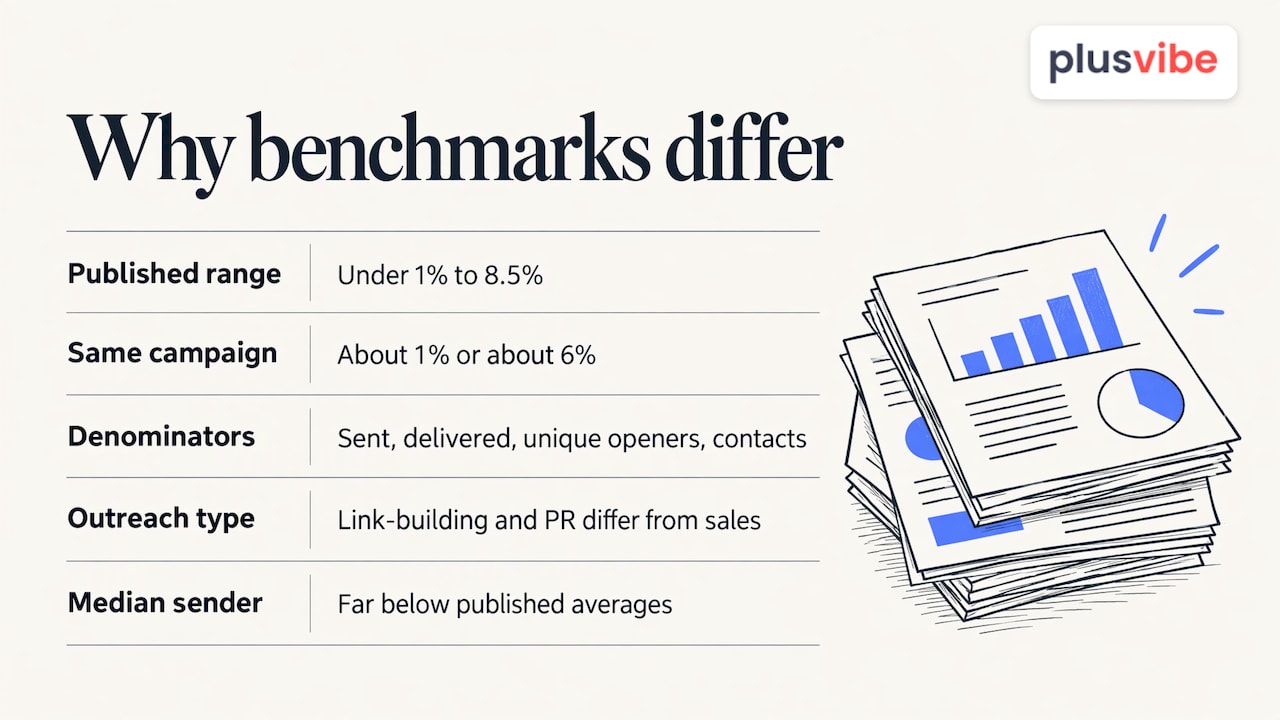
If you have looked at published benchmarks, you have seen figures from under 1% to 8.5%. IvrisTech’s analysis of the discrepancy explains that four denominators are in use: total sent, delivered, unique openers and contacts. It also notes that tools differ on whether they count auto-replies and follow-up replies. The same campaign can honestly report about 1% or about 6% depending on the definitions alone.
Two more things distort comparisons. Some headline figures come from link-building and PR outreach rather than sales prospecting, which behaves differently. And a median sender usually performs far below the published averages, which are pulled up by well-run programs.
The takeaway: don’t chase a benchmark number. Use benchmarks only for a rough sanity check, and set your own baseline from your first few hundred delivered emails.
Metrics to track alongside reply rate
Reply rate alone can mislead. A campaign can get plenty of replies that say “remove me.” Track these together, at least weekly:
- Emails sent and delivered, so the denominator is always visible.
- Bounce rate. Rising bounces point to list quality. A common working target is to keep it low, in the low single digits at most.
- Unsubscribes and spam complaints. These warn you about targeting and frequency problems.
- Overall reply rate (human replies only).
- Positive reply rate: positive replies, interested-later replies and useful referrals, divided by delivered emails.
- Meetings booked and meetings held. This is the metric that pays the bills.
Break each of these down by campaign, by step and by sending mailbox. A mailbox with a reply rate far below its siblings usually has a placement problem, not a messaging one. For a deeper look at which numbers deserve attention and which to ignore, see our guide to cold email metrics that matter and the broader list of email campaign performance metrics.
How to track replies consistently at volume
Once you send from many inboxes, spreadsheets stop working. The method is the same whether you use a platform or build your own reporting.
- Label every send. Give each message a campaign label, a step number and the sending mailbox.
- Match replies to the thread. Tie every inbound reply to the original thread, not just to the sender address, so a person who replies twice counts once.
- Store raw events, then calculate. Keep the original event records and compute rates from them, so you can change a definition later without losing history.
- Deduplicate. Count unique people, not notifications.
- Filter automatic responders before they reach the metrics.
- Anchor cohorts to send date. Replies arrive days after the send, so a Monday cohort’s rate keeps rising for a week. Compare cohorts only after the same waiting period.
This is also how developer documentation frames it. Nylas’s email analytics guide recommends logging sends with campaign labels, ingesting engagement events through webhooks, verifying their signatures, storing raw events and grouping metrics by campaign label. It maps reply rate to replied-thread events divided by sent messages.
If you want the monitoring habit without building anything, a cost-effective email marketing guide covers the basics of campaign reporting. For the handling side, we wrote about managing cold email replies without losing deals, because a tracked reply you answer late is still a lost reply.
Reading the number: diagnosing a low or falling reply rate
Work through the causes in order, from cheapest to check to hardest to fix. Changing copy first is the most common mistake.
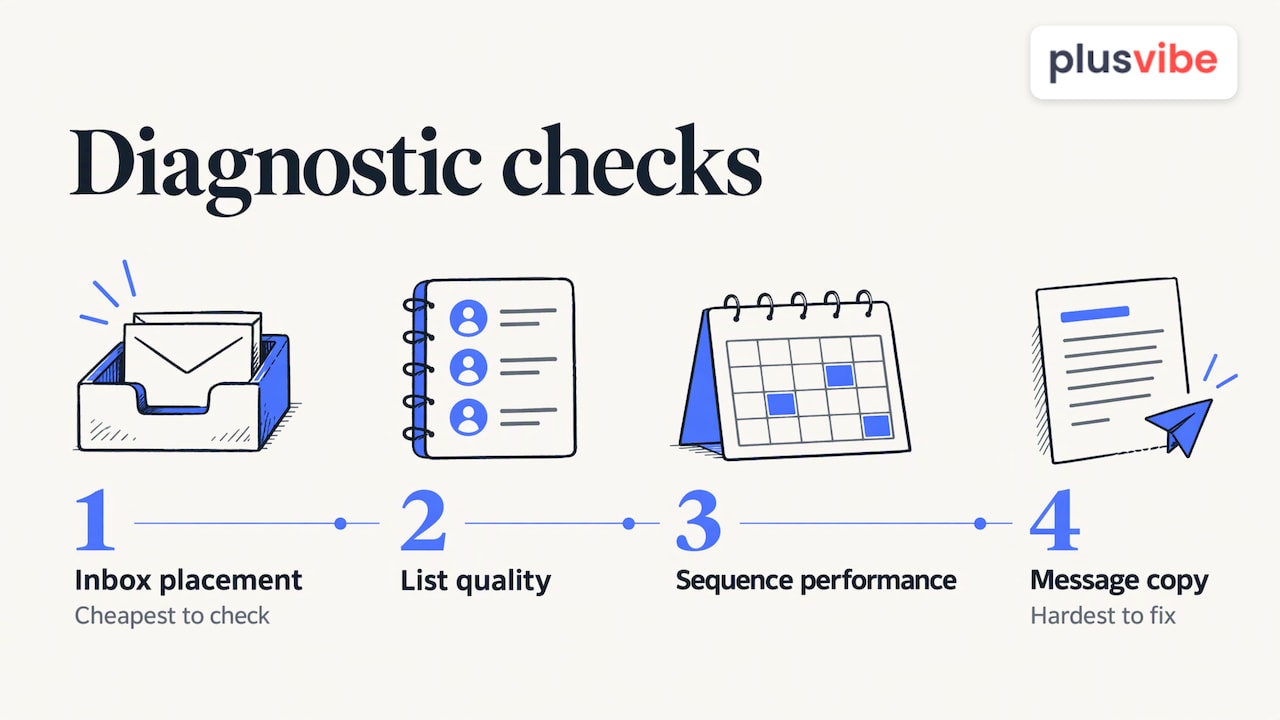
1. Is the email reaching the inbox?
A reply rate can only be as high as the share of mail that lands where people see it. If a mailbox’s replies fall suddenly while its volume stays steady, test placement before you touch anything else. Warm-up, inbox rotation and ongoing email deliverability monitoring exist for exactly this reason. Check your email deliverability rate alongside bounces and complaints.
2. Is the list right?
High bounces, wrong-person replies and “not relevant” answers point at the list. Verify addresses before sending and tighten the targeting. Enriching records with accurate role and company data helps; see what lead enrichment involves and how lead qualification keeps poor-fit contacts out of a sequence.
3. Is it one step or the whole sequence?
Per-step rates show where interest drops. If step 1 performs and later steps produce almost nothing, shorten the sequence. One analysis summarized by Outboundwiki reports that sequences with one or two follow-ups outperformed those with four or more, though treat that as a directional pointer rather than a rule for your market.
4. Is the message the problem?
Only now look at copy: the subject line, the first line, the offer and the call to action. Our guides on cold email outreach tips and writing outreach emails that get responses cover this ground.
Improving reply rate and proving it worked
A change only counts if you can measure its effect. GTMStack’s experimentation guide recommends randomized tests that change one variable at a time, run long enough to gather adequate data, and confirm any apparent winner before you roll it out.
It also shares an example from a test of 2,400 sends: a pain-point subject line produced a 4.7% reply rate against 3.9% for a company-name subject line, a 19% relative lift. That is a useful illustration of the method, not a promise of what your audience will do.
A practical testing routine:
- Split each list randomly into equal groups.
- Change one thing: subject line, opening line, offer or call to action.
- Keep sending days, mailboxes and list source the same across the groups.
- Compare positive reply rate, not only overall reply rate.
- Wait for the same reply window before judging.
Not sure what to test first? Start with our walkthrough of A/B testing for sequences, and borrow ideas from sales email subject lines and cold email example templates.
Perspective
Most teams we talk to treat reply rate as a copywriting score. We see it as the last number in a chain: infrastructure, list, sequence, then message.
That is why we built PlusVibe around the front of the chain. Private warm-up, isolated sending infrastructure, dedicated connector IPs, inbox rotation and deliverability monitoring are designed to keep your mail where people can answer it. Email verification and AI-powered prospect enrichment are there to keep the list clean before the first send.
When the foundation is controlled, your reply data becomes trustworthy. A change in reply rate then means something about your offer or your audience, not a hidden placement issue. Track per mailbox, per campaign and per step, and let the numbers tell you where to look.
Yaro
Track replies in one place with PlusVibe
If you run outreach from several inboxes, tracking is easier when sending, warm-up, replies and analytics live in one platform. PlusVibe is a cold email and prospecting platform with campaign sequencing, analytics, deliverability monitoring and integrations with tools such as HubSpot, Zapier, Slack, Gmail and Outlook, so reply data can flow where your team already works.
Plans start with the Personal plan at $37-$58 per month, and the Business plan runs $77-$220 per month. Agencies managing client campaigns can look at the Agency plan from $497 per month. All of it is on our plans page, and you can begin with a free trial. If you would rather not set up inboxes yourself, there is also done-for-you email setup at $1500 per month, and our email warm-up page explains how private warm-up works.
FAQ
What is a good cold email reply rate?
It depends on the definition, the audience and the offer, which is why published figures range so widely. Many sources report averages of a few percent, with the median sender lower. Set a baseline from your own delivered emails and aim to beat it, measuring human replies only.
Should I use sent or delivered emails as the denominator?
Delivered is the cleaner choice, because it removes hard bounces that never had a chance to get a reply. Sent emails is stricter and common in tool dashboards. Either works if you use it consistently and say which one you used.
What is the difference between reply rate and positive reply rate?
Reply rate counts every genuine human response. Positive reply rate counts only interested replies, interested-later replies and useful referrals, divided by delivered emails. Positive reply rate is closer to meetings, so track both.
How long should I wait before judging a campaign?
Replies keep arriving for days after a send. Compare campaigns only after the same waiting period, such as a full week from the last send in the cohort. Judging a Monday cohort on Tuesday will always undercount.
Sources
- Cold Email Reply Rate Benchmarks (6M Emails)
- Cold Email Reply Rate Per Step: How to Calculate It
- What Is Reply Rate? Formula and Example
- Cold Email Reply Rate: 0.45% or 8.5%? Both Are Real
- Build an email analytics dashboard
- Email sequence performance analysis
- Running Experiments in GTM: A Data-Driven Approach